Link iNaturalist observations to TRY#
Link iNaturalist vascular plant observations to the previously created trait TRY summary statistics.
This section covers:
Load data
Link iNat and TRY
Fuzzy merge
Log trait values
Number of observations per trait
Plot observation density after linking
Packages#
import pandas as pd
import os
import numpy as np

# fuzzy matching
#import rapidfuzz
from rapidfuzz import process, fuzz

# plotting
import matplotlib.pyplot as plt
import seaborn as sns
from matplotlib.colors import LogNorm, Normalize
import cartopy.crs as ccrs # plot maps
from matplotlib.colors import BoundaryNorm
from matplotlib.ticker import MaxNLocator
from mpl_toolkits.axes_grid1 import make_axes_locatable
Load data#
We load the iNaturalist vascular plant observations and the TRY summary stats per species.
iNat = pd.read_csv("Data/iNat/observations.csv")
iNat.head(3)
| gbifID | scientificName | decimalLatitude | decimalLongitude | eventDate | dateIdentified | |
|---|---|---|---|---|---|---|
| 0 | 1229615436 | Commelina communis | 35.987483 | -79.057546 | 2013-07-07T00:00:00 | 2013-07-07T20:33:11 |
| 1 | 1802610589 | Blitum capitatum | 40.320259 | -105.604856 | 2013-08-24T13:30:00 | 2019-09-02T01:11:54 |
| 2 | 1212005116 | Passiflora vitifolia | 23.189257 | -106.404924 | 2014-03-18T12:49:37 | 2017-02-23T17:24:07 |
Load trait measurments with consolidated species name:
TRY = pd.read_csv("Data/TRY/TRY_summary_stats.csv")
TRY.head(2)
| AccSpeciesName | Dispersal unit length | Leaf Area | SLA | Leaf C | LDMC | Leaf fresh mass | Leaf N per area | Leaf N per mass | Leaf delta15N | Leaf N P ratio | Leaf P | Plant Height | Seed mass | Seed length | Seeds per rep. unit | Stem conduit density | SSD | Conduit element length | |
|---|---|---|---|---|---|---|---|---|---|---|---|---|---|---|---|---|---|---|---|
| 0 | Aa | NaN | NaN | 9.433962 | NaN | NaN | NaN | 2.7984 | 26.4 | NaN | NaN | NaN | NaN | NaN | NaN | NaN | NaN | NaN | NaN |
| 1 | Aaronsohnia pubescens | NaN | NaN | NaN | NaN | NaN | NaN | NaN | NaN | NaN | NaN | NaN | 0.2 | NaN | NaN | NaN | NaN | NaN | NaN |
TRY.shape
(51908, 19)
iNat.shape
(14019405, 6)
# check that we have only unique observation ID's
iNat["gbifID"].nunique()
14019405
Link iNaturalist and TRY#
Non-fuzzy merge with TRY summary stats on consolidated TRY species name:
iNat_TRY = pd.merge(iNat, TRY,
                    left_on= ['scientificName'],
                    right_on= ['AccSpeciesName'],
                    how='inner')
iNat_TRY.head(3)
| gbifID | scientificName | decimalLatitude | decimalLongitude | eventDate | dateIdentified | AccSpeciesName | Dispersal unit length | Leaf Area | SLA | ... | Leaf delta15N | Leaf N P ratio | Leaf P | Plant Height | Seed mass | Seed length | Seeds per rep. unit | Stem conduit density | SSD | Conduit element length | |
|---|---|---|---|---|---|---|---|---|---|---|---|---|---|---|---|---|---|---|---|---|---|
| 0 | 1229615436 | Commelina communis | 35.987483 | -79.057546 | 2013-07-07T00:00:00 | 2013-07-07T20:33:11 | Commelina communis | NaN | NaN | NaN | ... | NaN | 12.631579 | 1.71 | NaN | 8.48 | NaN | NaN | NaN | NaN | NaN |
| 1 | 3384000233 | Commelina communis | 42.093762 | -75.923660 | 2021-08-23T13:06:06 | 2021-09-17T21:15:37 | Commelina communis | NaN | NaN | NaN | ... | NaN | 12.631579 | 1.71 | NaN | 8.48 | NaN | NaN | NaN | NaN | NaN |
| 2 | 1807276585 | Commelina communis | 40.787636 | -73.933728 | 2017-09-04T12:47:58 | 2017-09-04T21:58:57 | Commelina communis | NaN | NaN | NaN | ... | NaN | 12.631579 | 1.71 | NaN | 8.48 | NaN | NaN | NaN | NaN | NaN |
3 rows × 25 columns
We repeat the same with the ‘original’ species name in TRY:
TRY_syn = pd.read_csv("Data/TRY/TRY_summary_stats_syn.csv")
TRY_syn.head(2)
| SpeciesName | Dispersal unit length | Leaf Area | SLA | Leaf C | LDMC | Leaf fresh mass | Leaf N per area | Leaf N per mass | Leaf delta15N | Leaf N P ratio | Leaf P | Plant Height | Seed mass | Seed length | Seeds per rep. unit | Stem conduit density | SSD | Conduit element length | |
|---|---|---|---|---|---|---|---|---|---|---|---|---|---|---|---|---|---|---|---|
| 0 | (fabaceae) | NaN | NaN | 21.3385 | NaN | NaN | NaN | 1.578157 | 33.150000 | NaN | NaN | NaN | NaN | NaN | NaN | NaN | NaN | NaN | NaN |
| 1 | (fabaceae) 20-25oblong | NaN | NaN | NaN | NaN | NaN | NaN | 1.761453 | 32.513864 | NaN | NaN | NaN | NaN | NaN | NaN | NaN | NaN | NaN | NaN |
Extract from TRY those observations that have not been matched:
# filter for observations not in merged dataframe:
iNat_rest = iNat[~iNat.gbifID.isin(iNat_TRY['gbifID'])]
iNat_rest.shape
(2541013, 6)
# non-fuzzy merge with TRY summary stats on original TRY species name:

iNat_TRY_syn = pd.merge(iNat_rest, TRY_syn,
                    left_on= ['scientificName'],
                    right_on= ['SpeciesName'],
                    how='inner')
iNat_TRY_syn.head(3)
| gbifID | scientificName | decimalLatitude | decimalLongitude | eventDate | dateIdentified | SpeciesName | Dispersal unit length | Leaf Area | SLA | ... | Leaf delta15N | Leaf N P ratio | Leaf P | Plant Height | Seed mass | Seed length | Seeds per rep. unit | Stem conduit density | SSD | Conduit element length | |
|---|---|---|---|---|---|---|---|---|---|---|---|---|---|---|---|---|---|---|---|---|---|
| 0 | 1802610589 | Blitum capitatum | 40.320259 | -105.604856 | 2013-08-24T13:30:00 | 2019-09-02T01:11:54 | Blitum capitatum | NaN | NaN | NaN | ... | NaN | NaN | NaN | 0.45 | NaN | NaN | NaN | NaN | NaN | NaN |
| 1 | 2283078677 | Blitum capitatum | 50.744232 | -120.511303 | 2019-06-29T17:50:28 | 2019-09-02T01:16:41 | Blitum capitatum | NaN | NaN | NaN | ... | NaN | NaN | NaN | 0.45 | NaN | NaN | NaN | NaN | NaN | NaN |
| 2 | 2864818488 | Blitum capitatum | 53.938056 | -106.068553 | 2020-08-22T12:22:09 | 2020-08-22T19:13:24 | Blitum capitatum | NaN | NaN | NaN | ... | NaN | NaN | NaN | 0.45 | NaN | NaN | NaN | NaN | NaN | NaN |
3 rows × 25 columns
subsets = [iNat_TRY, iNat_TRY_syn]

iNat_TRY_all = pd.concat(subsets)
iNat_TRY_all = iNat_TRY_all.drop(['AccSpeciesName', 'SpeciesName'], axis = 1)
iNat_TRY_all.head(3)
| gbifID | scientificName | decimalLatitude | decimalLongitude | eventDate | dateIdentified | Dispersal unit length | Leaf Area | SLA | Leaf C | ... | Leaf delta15N | Leaf N P ratio | Leaf P | Plant Height | Seed mass | Seed length | Seeds per rep. unit | Stem conduit density | SSD | Conduit element length | |
|---|---|---|---|---|---|---|---|---|---|---|---|---|---|---|---|---|---|---|---|---|---|
| 0 | 1229615436 | Commelina communis | 35.987483 | -79.057546 | 2013-07-07T00:00:00 | 2013-07-07T20:33:11 | NaN | NaN | NaN | NaN | ... | NaN | 12.631579 | 1.71 | NaN | 8.48 | NaN | NaN | NaN | NaN | NaN |
| 1 | 3384000233 | Commelina communis | 42.093762 | -75.923660 | 2021-08-23T13:06:06 | 2021-09-17T21:15:37 | NaN | NaN | NaN | NaN | ... | NaN | 12.631579 | 1.71 | NaN | 8.48 | NaN | NaN | NaN | NaN | NaN |
| 2 | 1807276585 | Commelina communis | 40.787636 | -73.933728 | 2017-09-04T12:47:58 | 2017-09-04T21:58:57 | NaN | NaN | NaN | NaN | ... | NaN | 12.631579 | 1.71 | NaN | 8.48 | NaN | NaN | NaN | NaN | NaN |
3 rows × 24 columns
iNat_TRY_all.shape
(11806220, 24)
iNat_TRY_all["gbifID"].nunique()
11806220
# agian filter for observations not in merged dataframe:
iNat_rest_2 = iNat[~iNat.gbifID.isin(iNat_TRY_all['gbifID'])]
iNat_rest_2.shape
(2213185, 6)
Check how much was matched:
print('iNat species:')
print(iNat["scientificName"].nunique())
print('TRY consolidated species:')
print(TRY["AccSpeciesName"].nunique())
print('TRY original species:')
print(TRY_syn["SpeciesName"].nunique())
print('species merged:')
print(iNat_TRY_all["scientificName"].nunique())
print('iNat species not merged:')
print(iNat_rest_2["scientificName"].nunique())

# percentage of iNat observations linked with at least one TRY trait
print('percentage of iNat observations linked with at least one TRY trait:')
print(len(iNat_TRY_all)/len(iNat))
iNat species:
90820
TRY consolidated species:
51908
TRY original species:
61180
species merged:
27783
iNat species not merged:
63037
percentage of iNat observations linked with at least one TRY trait:
0.8421341704587321
Fuzzy merge#
Get only unique species names left in iNaturalist unmatched observations:
iNat_rest_unique = iNat_rest_2.drop_duplicates(subset=['scientificName'])
Get only unique unmatched TRY species names:
pd.options.mode.chained_assignment = None

TRY = pd.read_csv("Data/TRY/TRY_summary_stats.csv")
TRY_alt =  pd.read_csv("Data/TRY/TRY_summary_stats_syn.csv")

TRY_rest = TRY[~TRY.AccSpeciesName.isin(iNat_TRY_all['scientificName'])]
TRY_alt_rest =  TRY_alt[~TRY_alt.SpeciesName.isin(iNat_TRY_all['scientificName'])]

TRY_alt_rest.rename(columns = {'SpeciesName':'AccSpeciesName'}, inplace = True)


TRY_R = pd.concat([TRY_rest, TRY_alt_rest])
TRY_rest_unique = TRY_R.drop_duplicates(subset=['AccSpeciesName'])

TRY_rest_unique.head()
| AccSpeciesName | Dispersal unit length | Leaf Area | SLA | Leaf C | LDMC | Leaf fresh mass | Leaf N per area | Leaf N per mass | Leaf delta15N | Leaf N P ratio | Leaf P | Plant Height | Seed mass | Seed length | Seeds per rep. unit | Stem conduit density | SSD | Conduit element length | |
|---|---|---|---|---|---|---|---|---|---|---|---|---|---|---|---|---|---|---|---|
| 0 | Aa | NaN | NaN | 9.433962 | NaN | NaN | NaN | 2.7984 | 26.4 | NaN | NaN | NaN | NaN | NaN | NaN | NaN | NaN | NaN | NaN |
| 2 | Abacaba (palm) | NaN | NaN | NaN | NaN | NaN | NaN | NaN | NaN | NaN | NaN | NaN | 15.0 | NaN | NaN | NaN | NaN | NaN | NaN |
| 4 | Abarema adenophorum | NaN | 3038.000000 | NaN | NaN | NaN | NaN | NaN | NaN | NaN | NaN | NaN | NaN | NaN | NaN | NaN | NaN | 0.360000 | NaN |
| 5 | Abarema alexandri | NaN | 675.000000 | NaN | NaN | NaN | NaN | NaN | NaN | NaN | NaN | NaN | NaN | NaN | NaN | NaN | NaN | NaN | NaN |
| 6 | Abarema barbouriana | NaN | 29.811258 | NaN | NaN | NaN | NaN | NaN | NaN | NaN | NaN | NaN | NaN | NaN | NaN | NaN | 18.496843 | 0.456346 | NaN |
# define choices and queries
# this might take a little while

choices = TRY_rest_unique["AccSpeciesName"].apply(str)
queries = iNat_rest_unique["scientificName"]


score_sort = [(x,) + i
             for x in queries
             for i in process.extract(x, choices, score_cutoff=90, scorer=fuzz.token_sort_ratio) ]

fuzzy_matches = pd.DataFrame(score_sort)
fuzzy_matches.head()
| 0 | 1 | 2 | 3 | |
|---|---|---|---|---|
| 0 | Sambucus cerulea | Sambucus caerulea | 96.969697 | 42779 |
| 1 | Anemonoides sylvestris | Anemone sylvestris | 90.000000 | 3146 |
| 2 | Elymus hystrix | Elymus histrix | 92.857143 | 20225 |
| 3 | Euphorbia enterophora | Euphorbia eriophora | 90.000000 | 19508 |
| 4 | Tanacetum partheniifolium | Tanacetum parthenifolium | 97.959184 | 47633 |
Save fuzzy match to .csv:
fuzzy_matches.to_csv("Data/fuzzy_matches.csv", sep = "\t",index=False)
Reload fuzzy matches:
fuzzy_matches =  pd.read_csv("Data/fuzzy_matches.csv", sep = "\t")
fuzzy_matches.head()
| 0 | 1 | 2 | 3 | |
|---|---|---|---|---|
| 0 | Sambucus cerulea | Sambucus caerulea | 96.969697 | 42779 |
| 1 | Anemonoides sylvestris | Anemone sylvestris | 90.000000 | 3146 |
| 2 | Elymus hystrix | Elymus histrix | 92.857143 | 20225 |
| 3 | Euphorbia enterophora | Euphorbia eriophora | 90.000000 | 19508 |
| 4 | Tanacetum partheniifolium | Tanacetum parthenifolium | 97.959184 | 47633 |
Add new names to unmatched iNaturalist observations: iNat_rest_2 with fuzzy_matches
fuzzy_matches.rename(columns = {'0':'scientificName'}, inplace = True)
fuzzy_matches.rename(columns = {'1':'fuzzyName'}, inplace = True)
iNat_rest_fuzzy = pd.merge(iNat_rest_2, fuzzy_matches, on='scientificName', how='inner')
Merge with TRY:
TRY = pd.read_csv("Data/TRY/TRY_summary_stats.csv")
TRY_alt =  pd.read_csv("Data/TRY/TRY_summary_stats_syn.csv")

TRY.rename(columns = {'AccSpeciesName':'fuzzyName'}, inplace = True)
iNat_TRY_fuzzy_1 = pd.merge(iNat_rest_fuzzy, TRY, on='fuzzyName', how='inner')
iNat_TRY_fuzzy_rest = iNat_rest_fuzzy[~iNat_rest_fuzzy.gbifID.isin(iNat_TRY_fuzzy_1['gbifID'])]
iNat_TRY_fuzzy_1= iNat_TRY_fuzzy_1.drop(columns=["fuzzyName", "2", "3"])

TRY_alt.rename(columns = {'SpeciesName':'fuzzyName'}, inplace = True)
iNat_TRY_fuzzy_2 = pd.merge(iNat_TRY_fuzzy_rest, TRY_alt, on='fuzzyName', how='inner')
iNat_TRY_fuzzy_2= iNat_TRY_fuzzy_2.drop(columns=["fuzzyName", "2", "3"])
# merge fuzzy-consolidated species name match and fuzzy-original match
frames = [iNat_TRY_fuzzy_1, iNat_TRY_fuzzy_2]

iNat_TRY_fuzzy_merge = pd.concat(frames)
iNat_TRY_fuzzy_merge['gbifID'].nunique()/len(iNat_TRY_fuzzy_merge['gbifID'])
0.9933762301286904
Drop iNat observation duplicates in fuzzy matches, keeping the row with the least NaN
iNat_TRY_fuzzy_merge_2 = (iNat_TRY_fuzzy_merge.assign(counts=iNat_TRY_fuzzy_merge.count(axis=1))
   .sort_values(['gbifID', 'counts'])
   .drop_duplicates('gbifID', keep='last')
   .drop('counts', axis=1))
iNat_TRY_fuzzy_merge.shape
(89828, 24)
iNat_TRY_fuzzy_merge_2.shape
(89233, 24)
Concatenate to make final dataframe:
frames = [iNat_TRY_all, iNat_TRY_fuzzy_merge_2]

iNat_TRY_final = pd.concat(frames)
Compare shape to number of unique gbif ID’s, check that they are the same. We want each observation represented only once:
iNat_TRY_final.shape
(11895453, 24)
iNat_TRY_final['gbifID'].nunique()
11895453
iNat_TRY_final.head()
| gbifID | scientificName | decimalLatitude | decimalLongitude | eventDate | dateIdentified | Dispersal unit length | Leaf Area | SLA | Leaf C | ... | Leaf delta15N | Leaf N P ratio | Leaf P | Plant Height | Seed mass | Seed length | Seeds per rep. unit | Stem conduit density | SSD | Conduit element length | |
|---|---|---|---|---|---|---|---|---|---|---|---|---|---|---|---|---|---|---|---|---|---|
| 0 | 1229615436 | Commelina communis | 35.987483 | -79.057546 | 2013-07-07T00:00:00 | 2013-07-07T20:33:11 | NaN | NaN | NaN | NaN | ... | NaN | 12.631579 | 1.71 | NaN | 8.48 | NaN | NaN | NaN | NaN | NaN |
| 1 | 3384000233 | Commelina communis | 42.093762 | -75.923660 | 2021-08-23T13:06:06 | 2021-09-17T21:15:37 | NaN | NaN | NaN | NaN | ... | NaN | 12.631579 | 1.71 | NaN | 8.48 | NaN | NaN | NaN | NaN | NaN |
| 2 | 1807276585 | Commelina communis | 40.787636 | -73.933728 | 2017-09-04T12:47:58 | 2017-09-04T21:58:57 | NaN | NaN | NaN | NaN | ... | NaN | 12.631579 | 1.71 | NaN | 8.48 | NaN | NaN | NaN | NaN | NaN |
| 3 | 3355124418 | Commelina communis | 39.643158 | -76.764245 | 2020-08-26T10:19:56 | 2020-08-27T13:21:22 | NaN | NaN | NaN | NaN | ... | NaN | 12.631579 | 1.71 | NaN | 8.48 | NaN | NaN | NaN | NaN | NaN |
| 4 | 1802638502 | Commelina communis | 43.109505 | 1.622543 | 2017-10-21T10:01:00 | 2017-10-21T09:02:42 | NaN | NaN | NaN | NaN | ... | NaN | 12.631579 | 1.71 | NaN | 8.48 | NaN | NaN | NaN | NaN | NaN |
5 rows × 24 columns
After matching with alternate name and a conservative fuzzy match, we were able to match about 85% of the iNaturalist observations with trait information. Many rare species seem to be absent in either one of the two databases.
print('percentage of iNat observations linked with at least one TRY trait:')
print(len(iNat_TRY_final)/len(iNat))

print('percentage of species in iNaturalist matched with TRY:')
print(iNat_TRY_final["scientificName"].nunique()/iNat["scientificName"].nunique())

print('percentage of species in TRY matched with iNaturalist:')
print(iNat_TRY_final["scientificName"].nunique()/TRY["fuzzyName"].nunique())
percentage of iNat observations linked with at least one TRY trait:
0.8484991338790769
percentage of species in iNaturalist matched with TRY:
0.3161528297731777
percentage of species in TRY matched with iNaturalist:
0.5531517299838176
iNat_TRY_final.to_csv("Data/iNat_TRY.csv", index=False)
Log trait values#
The cwm in sPlot were caluclated after being log e transformed, so we must log e transform iNat data also:
trait = iNat_TRY_final.columns[6:24]
iNat_TRY_final.loc[:, trait] = np.log(iNat_TRY_final[trait])
iNat_TRY_final = iNat_TRY_final.replace(-np.inf, np.nan)
iNat_TRY_final = iNat_TRY_final.replace(np.inf, np.nan)
iNat_TRY_final.to_csv("Data/iNat_TRY_log.csv", index=False)
Number of observations per trait#
iNat_TRY_final.head()
| gbifID | scientificName | decimalLatitude | decimalLongitude | eventDate | dateIdentified | Dispersal unit length | Leaf Area | SLA | Leaf C | ... | Leaf delta15N | Leaf N P ratio | Leaf P | Plant Height | Seed mass | Seed length | Seeds per rep. unit | Stem conduit density | SSD | Conduit element length | |
|---|---|---|---|---|---|---|---|---|---|---|---|---|---|---|---|---|---|---|---|---|---|
| 0 | 1229615436 | Commelina communis | 35.987483 | -79.057546 | 2013-07-07T00:00:00 | 2013-07-07T20:33:11 | NaN | NaN | NaN | NaN | ... | NaN | 2.5362 | 0.536493 | NaN | 2.13771 | NaN | NaN | NaN | NaN | NaN |
| 1 | 3384000233 | Commelina communis | 42.093762 | -75.923660 | 2021-08-23T13:06:06 | 2021-09-17T21:15:37 | NaN | NaN | NaN | NaN | ... | NaN | 2.5362 | 0.536493 | NaN | 2.13771 | NaN | NaN | NaN | NaN | NaN |
| 2 | 1807276585 | Commelina communis | 40.787636 | -73.933728 | 2017-09-04T12:47:58 | 2017-09-04T21:58:57 | NaN | NaN | NaN | NaN | ... | NaN | 2.5362 | 0.536493 | NaN | 2.13771 | NaN | NaN | NaN | NaN | NaN |
| 3 | 3355124418 | Commelina communis | 39.643158 | -76.764245 | 2020-08-26T10:19:56 | 2020-08-27T13:21:22 | NaN | NaN | NaN | NaN | ... | NaN | 2.5362 | 0.536493 | NaN | 2.13771 | NaN | NaN | NaN | NaN | NaN |
| 4 | 1802638502 | Commelina communis | 43.109505 | 1.622543 | 2017-10-21T10:01:00 | 2017-10-21T09:02:42 | NaN | NaN | NaN | NaN | ... | NaN | 2.5362 | 0.536493 | NaN | 2.13771 | NaN | NaN | NaN | NaN | NaN |
5 rows × 24 columns
iNat_TRY.count().round(decimals=-5)
gbifID                    11500000
scientificName            11500000
decimalLatitude           11500000
decimalLongitude          11500000
eventDate                 11500000
dateIdentified            11400000
AccSpeciesName            11500000
Dispersal unit length      4700000
Leaf Area                  4800000
SLA                        7600000
Leaf C                     5000000
LDMC                       6700000
Leaf fresh mass            2700000
Leaf N per area            5700000
Leaf N per mass            7000000
Leaf delta15N              2400000
Leaf N P ratio             3800000
Leaf P                     5100000
Plant Height               9500000
Seed mass                 10200000
Seed length                3500000
Seeds per rep. unit        4000000
Stem conduit density       1200000
SSD                        3400000
Conduit element length      300000
dtype: int64
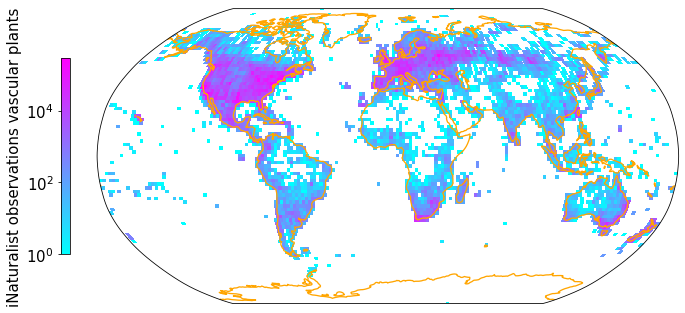
Density of observations after linking#
plt.rcParams.update({'font.size': 15})

Z, xedges, yedges = np.histogram2d(np.array(iNat_TRY['decimalLongitude'],dtype=float),
                                   np.array(iNat_TRY['decimalLatitude']),bins = [181, 91])

data_crs = ccrs.PlateCarree()
#for colorbar
cmap = plt.get_cmap('cool')
im_ratio = Z.shape[0]/Z.shape[1]

#plot map
fig = plt.figure(figsize=(12, 12)) # I created a new figure and set up its size

#create base plot of a world map
ax = fig.add_subplot(1, 1, 1, projection=ccrs.Robinson()) # I used the PlateCarree projection from cartopy
ax.set_global()
#add coastlines
ax.coastlines(resolution='110m', color='orange', linewidth=1.3)
#add grid with values
im = ax.pcolormesh(xedges, yedges, Z.T, cmap="cool", norm=LogNorm(), transform=data_crs)
#add color bar
#divider = make_axes_locatable(ax)
#cax = divider.append_axes("right", size="3%", pad=0.05)
#fig.colorbar(im, cax=cax)
fig.colorbar(im,fraction=0.046*im_ratio, pad=0.04, shrink=0.3, location="left", label="iNaturalist observations vascular plants")


plt.savefig('Figures/iNat_density_Robinson_TRY.pdf', bbox_inches='tight')